Visual Studio Code で Verilog HDL を書いて Icarus Verilog でシミュレーションする
環境は Windows11です。
やることまとめ
- Visual Studio Code (エディタ)をインストールする
- Visual Studio Code の拡張機能 Verilog-HDL/SystemVerilog/Bluespec SystemVerilog をインストールする
- Icarus Verilog (シミュレータ)と GTKWave(タイミングチャート描画ツール)をインストールする
- ハローワールド的なテストをする
参考
【Icarus】Verilog開発環境構築【Visual Studio code】|瓦家(Kawara-ya)|note
↑が詳細です。この記事はクイックノートだと思ってください。
Visual Studio Code をインストール
Visual Studio Code - Code Editing. Redefined
ダウンロードしてインストール。
VSCode でも Vim 的なキーバインドで操作したいよね、という人は neovim を入れるといいかも。手順は以下。
Powershell をインストール(アップデート)
chocolatey をインストール、chocolatey で neovim をインストール
https://zenn.dev/altair/articles/aa54cf574636f2
https://docs.chocolatey.org/en-us/choco/setup
パッケージマネージャを使う方法もありかも
https://qiita.com/tats-u/items/89f401ff5555170fc41d
Visual Studio Code で vscode-neovim をインストール、neovimのパスを設定(VSCodeの再起動が必要かも)
https://ascii.jp/elem/000/004/036/4036471/
詳しい参考はここ↓
超融合!時空を越えた絆 Neo Vim(VSCode)を試してみた
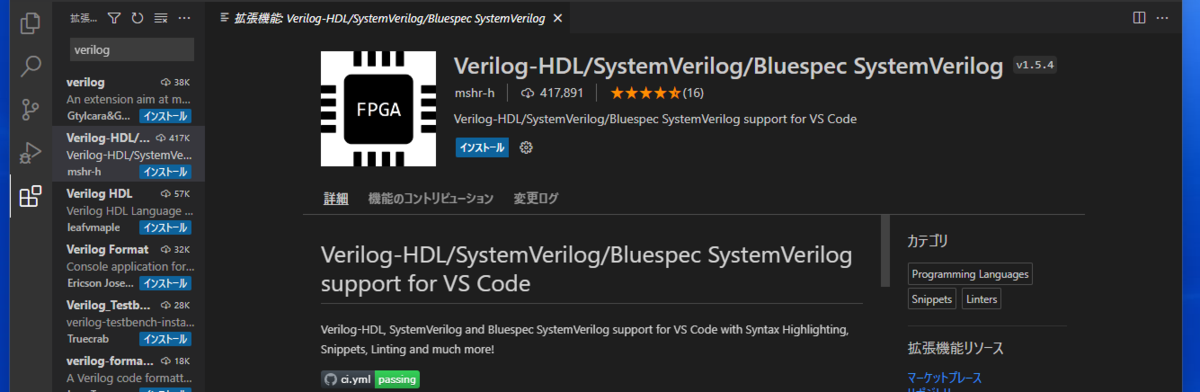
Visual Studio Code の拡張機能 Verilog-HDL/SystemVerilog/Bluespec SystemVerilog をインストール
Icarus Verilog と GTKWave をインストール
今日(2022/09/23)の時点では iverilog-v12-20220611-x64_setup [18.2MB] が最新だったのでこれをダウンロード、実行してインストールウィザードを進める。


テスト
本当はテストコードを書いて公開するつもりだったけど時間がないのであとは配信で確認してください!
WSL で gnuplot を使う
こんにちは世界。
- 内容
- VcXsrvを入れる
- gnuplot を使えるようにする
- Raku の Chart::Gnuplot を使う
- Raku で計算してプロット
- png を動画にする
- アニメ化
- 余弦波の和がデルタ関数になる理由
- References
内容
WSL の Ubuntu20.04 で gnuplot を使おうとしたときのメモです。VcXsrv を使います。あと Raku の Chart::Gnuplot を使ってみました。
VcXsrvを入れる
https://sourceforge.net/projects/vcxsrv/ からVcXsrvをダウンロードし、
- https://astherier.com/blog/2020/08/run-gui-apps-on-wsl2/
- https://veresk.hatenablog.com/entry/2020/02/26/190000
を参考にVcXsrvを入れます。
ただし私の環境では .profile の末尾には export DISPLAY=:0 を追加しました(nameserver からとってくるIPアドレスが windows のIPアドレスと異なるIPアドレスなのでうまくいかなかった)。 ここの設定は環境によって変わりそうです。
https://qiita.com/nishemon/items/bb3aca972404f68bfcd6 に書いてあるようにwindowsのフォントを使えるようにシンボリックリンクを作る
sudo apt install fontconfig
sudo ln -s /mnt/c/Windows/Fonts /usr/share/fonts/windows
sudo fc-cache -fv
fc-list
windowsのフォントがいっぱい表示されればOKです。
gnuplot を使えるようにする
インストールしたものをまとめておくと
sudo apt install libsdl2-dev libcairo2-dev gnuplot gnuplot-x11 eog yaru-theme-icon yaru-theme-gtk
gnuplot したときに Error loading theme icon 'document-save-as' for stock: Icon 'document-save-as' not present in theme Yaru が出たのでテーマを入れています。これを入れないとファイルを保存のアイコン画像が表示されなかったりします。
Raku の Chart::Gnuplot を使う
Raku の Chart::Gnuplot を使うには
zef install SDL2::Raw
zef install Cairo
zef install Chart::Gnuplot
particle や snake などのデモができます。
忘れていたので aliasにraku='rakudo'を登録しました。 ~/.bashrc の末尾に alias raku='rakudo' を追加し、~/.profile に source ~/.bashrc を追加して設定が反映されるようにします。
/home/ユーザ名/.p6chart-gnuplot/bin にある gnuplot が自分で入れたやつじゃない(verは一緒だけどpatchlevelが違った)のでシンボリックリンクを作りました。
which gnuplot
で gnuplot の場所を探したら /usr/bin/gnuplot に置かれていたので
cd ~/.p6chart-gnuplot/bin
ln -s /usr/bin/gnuplot gnuplot
Raku で計算してプロット
今回新たに
zef install Math::Libgsl::Function
zef install Math::Libgsl::Constant
をインストールしました。
前回インストールした Math::Libgsl::Vector のバージョンが古いままでした。 Vector::View の subvector が使いたいので
zef update
zef upgrade
を実行しました。
Chart::Gnuplot は動いたんですけど multiplot があまりうまく動きませんでした。 番号の割り振りに問題があるのかな?
use Math::Libgsl::Vector;
use Math::Libgsl::Function :trig;
use Chart::Gnuplot;

my constant f0 = 1.0;
my constant fmax = 100.0;
my constant fs = fmax * 2; # to plot smooth line
my constant xmax = 2.5 / f0;
my constant Ns = ceiling(2 * fs * xmax); # number of sample points

my Math::Libgsl::Vector $t .= new(:size(Ns));
my Math::Libgsl::Vector $v1 .= new(:size(Ns));
my Math::Libgsl::Vector $v2 .= new(:size(Ns));
my Math::Libgsl::Vector $average .= new(:size(Ns));


$t[$_] = $_ / fs for 0..^Ns;
$t.add-constant(-1 * ceiling(Ns / 2) / fs);
$v1[$_] = gsl-cos(2 * pi * f0 * $t[$_]) for 0..^Ns;
$v2[$_] = gsl-cos(2 * pi * 2 * f0 * $t[$_]) for 0..^Ns;
$average.setall(0); # initialize

#my @x-data = 0 xx Ns;
#my @y-data = 0 xx Ns;
#my @x-data = 0..20;
#{@x-data[$_] = $t[$_]} for 0..^Ns;
#{@y-data[$_] = $v1[$_]} for 0..^Ns;
my @vertices1[Ns];
my @vertices2[Ns];
#{@vertices[$_] = [$t[$_], $v1[$_]]} for 0..^Ns;
{@vertices1[$_] = [$t[$_], $v1[$_]]} for 0..^Ns;
{@vertices2[$_] = [$t[$_], $v2[$_]]} for 0..^Ns;

my $gnu = Chart::Gnuplot.new(:terminal("png"), :filename("cos.png"));
$gnu.command("set multiplot layout 2,1");
#$gnu.command("plot sin(x)");
#$gnu.command("plot cos(x/2)");
# $gnu.title(:text("test"));
$gnu.plot(:vertices(@vertices1), :style("lines"), :title("cos(2pi ft)"));
sleep 3.0;
#$gnu.plot(:function("sin(x)"), :style("lines"), :title("cos(2pi ft)"));
$gnu.command("plot cos(x/2)");
$gnu.command("unset multiplot");
#$gnu.command("set terminal x11");
#$gnu.command("set output");
#$gnu.command("exit");
$gnu.dispose;
# $gnu.multiplot(:layout([2,1]));

#my $size = 3;

#$v1.setall(1); # $v1 = (1 1 1)
#$v2.setall(2); # $v2 = (2 2 2)
#$v1.add($v2); # $v1 += $v2

#print "$v1[$_] " for 0..^3;
#say "";
なのでいったん dat として出力して gnuplot しました。何一つ整理していないコードですがメモですのでご容赦ください。Raku 内で gnuplot 用のスクリプトを出力して実行させてます。
#!/usr/bin/rakudo

use Math::Libgsl::Vector;
use Math::Libgsl::Function :trig; # to use gsl-cos()
use Chart::Gnuplot;

my constant f0 = 1;
my constant kmax = 50;
my constant fmax =kmax * f0;
my constant fs = 301; #fmax * 2; # fmax + 2.01; #101; #fmax * 10; #2.01; # actually Nyquist rate is not so important in this program
my constant tmax = 2.5; # 3.0; #2.5 / f0;
my constant Ns = ceiling(2 * fs * tmax); # number of sample points

my Math::Libgsl::Vector $t-vec .= new(:size(Ns));
#my Math::Libgsl::Vector $v1 .= new(:size(Ns));
my Math::Libgsl::Vector $v1 .= new(:size(kmax + 1));
$v1.zero();

sub sum-vector(Math::Libgsl::Vector $v) {
    my $parity = $v.size % 2;
    # my $length-ceil = ceiling($v.size / 2);
    my $half-length = floor($v.size / 2);
    if ($half-length == 0) {
        return $v[0];
    } else {
        my Math::Libgsl::Vector::View $vl .= new;
        my Math::Libgsl::Vector::View $vr .= new;
        my Math::Libgsl::Vector::View $v-accum .= new;
        my Math::Libgsl::Vector $v-half = $vl.subvector($v, 0, $half-length);
        $v-half.add($vr.subvector($v, $half-length + $parity, $half-length).reverse());
        sum-vector($v-accum.subvector($v, 0, $half-length + $parity));
    }
}

my $cos-file-name = 'cos.dat';
my $sum-file-name = 'sum.dat';

sub pnggen($f, $f0) {
    shell "rm $cos-file-name" if "$cos-file-name".IO.e;
    shell "rm $sum-file-name" if "$sum-file-name".IO.e;


    $t-vec[$_] = $_  / fs for 0..^Ns;
    $t-vec.add-constant(-1 * ceiling(Ns / 2) / fs);
    for (0..^Ns) -> $i {
        my $t = $t-vec[$i];
        $v1.zero();
        spurt($cos-file-name, "$t ", :append);
        for (1..$f) -> $k { #for (1..kmax) -> $k {
            $v1[$k] = $f0 * gsl-cos(2 * pi * $k * $f0 * $t);
            # $v1[$k] = gsl-cos(2 * pi * $k * $f0 * $t);
            spurt($cos-file-name, "$v1[$k] ", :append);
        }
        spurt($cos-file-name, "\n", :append);
        my $sum = sum-vector($v1);
        # say "$t $sum";
        spurt($sum-file-name, "$t $sum\n", :append);
    }


    my $file-gp = 'script-gp.txt';
    #my $serial = "$f".fmt('%03d');
    my $serial = "{10/$f0}".fmt('%03d');
    my $plt-str = 'plot "cos.dat" using 1:2 title \'\' w l, ';
    for (1..^$f) -> $r {
        my $r-num = $r + 2;
        $plt-str = $plt-str ~ " '' using 1:$r-num title '' w l, ";
    }
    $plt-str = $plt-str ~ "\n";
    shell "rm $file-gp" if "$file-gp".IO.e;
    spurt($file-gp, "set terminal pngcairo\n", :append);
    spurt($file-gp, "set output 'test-$serial.png'\n", :append);
    ## spurt($file-gp, "set terminal gif\n", :append);
    ## spurt($file-gp, "set output 'test-$serial.gif'\n", :append);
    ## spurt($file-gp, "set size 2.0, 2.0\n", :append);
    spurt($file-gp, "set xrange [-2.5:2.5]\n", :append);
    spurt($file-gp, "set grid\n", :append);
    spurt($file-gp, "set multiplot layout 2,1\n", :append);
    spurt($file-gp, 'set title "f_0 cos(2{/Symbol p}n{f_0}t)' ~ " for n=1:$f, f0 = $f0" ~ '"' ~ "\n", :append);
    spurt($file-gp, "set yrange [-1.1:1.1]\n", :append);
    ## spurt($file-gp, 'plot "cos.dat" using 1:2 w l' ~ "\n", :append);
    spurt($file-gp, $plt-str, :append);
    spurt($file-gp, 'set title "{/Symbol S}^{' ~ "$f" ~ '}_{n = 1} f_0 cos(2{/Symbol p}n{f_0}t)' ~ "\n", :append);
    # spurt($file-gp, 'set title "{/Symbol S}^{/Symbol \245}_{n = 1} cos(2{/Symbol p}n{f_0}t)' ~ "\n", :append);
    # spurt($file-gp, "set yrange [-2:{$f+1}]\n", :append);
    spurt($file-gp, "set yrange [-2:11]\n", :append);
    # spurt($file-gp, "set yrange [-5:30]\n", :append);
    # spurt($file-gp, "set yrange [-5:15]\n", :append);
    spurt($file-gp, 'plot "sum.dat" using 1:2 title "sum" w l' ~ "\n", :append);
    spurt($file-gp, "unset multiplot\n", :append);

    shell "gnuplot-x11 $file-gp";
    # shell "eog test.png";
}
#pnggen(50);

my $f0 = Int(100/30)/10.0;
my $x = ceiling(10/$f0);
for (1..20) -> $ff {
    say "$x, $f0";
    pnggen($x, $f0 + $ff);
}
vector の要素の総和を計算する関数が見つけられなかったのでベクトルを折り返しながら足していく関数を作りました。ただ上手くやらないと積み残しの誤差とかが出ちゃうので気を付けたいです。
書き出されて実行される gnuplot のスクリプトはこんな感じです。
set terminal pngcairo
set output 'test-000.png'
set xrange [-2.5:2.5]
set grid
set multiplot layout 2,1
set title "f_0 cos(2{/Symbol p}n{f_0}t) for n=1:34, f0 = 20.3"
set yrange [-1.1:1.1]
plot "cos.dat" using 1:2 title '' w l,  '' using 1:3 title '' w l,  '' using 1:4 title '' w l,  '' using 1:5 title '' w l,  '' using 1:6 title '' w l,  '' using 1:7 title '' w l,  '' using 1:8 title '' w l,  '' using 1:9 title '' w l,  '' using 1:10 title '' w l,  '' using 1:11 title '' w l,  '' using 1:12 title '' w l,  '' using 1:13 title '' w l,  '' using 1:14 title '' w l,  '' using 1:15 title '' w l,  '' using 1:16 title '' w l,  '' using 1:17 title '' w l,  '' using 1:18 title '' w l,  '' using 1:19 title '' w l,  '' using 1:20 title '' w l,  '' using 1:21 title '' w l,  '' using 1:22 title '' w l,  '' using 1:23 title '' w l,  '' using 1:24 title '' w l,  '' using 1:25 title '' w l,  '' using 1:26 title '' w l,  '' using 1:27 title '' w l,  '' using 1:28 title '' w l,  '' using 1:29 title '' w l,  '' using 1:30 title '' w l,  '' using 1:31 title '' w l,  '' using 1:32 title '' w l,  '' using 1:33 title '' w l,  '' using 1:34 title '' w l,  '' using 1:35 title '' w l,
set title "{/Symbol S}^{34}_{n = 1} f_0 cos(2{/Symbol p}n{f_0}t)
set yrange [-2:11]
plot "sum.dat" using 1:2 title "sum" w l
unset multiplot
png を動画にする
convert -delay 50 -loop 0 test-*.png matome.gif
を使ってgifアニメにして
eog matome.gif
で確認できます。あとは sudo apt install ffmpeg して
ffmpeg -r 2 -i 'out(%d).png' -pix_fmt yuv420p output.mp4
で mp4 にできます。元画像のサイズは
mogrify -resize 640x480 test-*.png
でリサイズできます。
png ファイルのナンバリングは rename 使った shellスクリプトを書くか、Windows だとファイルをドラッグアンドドロップで選択して番号を付けると一括でナンバリングできるのでそれを使うのが楽です。
アニメ化
こんな感じです。
余弦波の和がデルタ関数になる理由
動画をご覧ください。
どうもありがとうございました。
References
文中記載に加えて
WSL (Windows Subsystem for Linux) に Ubuntu20.04 を入れて Raku (Perl6) の Math::Libgsl::Matrix を使う
こんにちは世界。
内容
タイトルの通りです。
- Windows10 で Linux の shell が使える WSL (Windows Subsystem for Linux) の機能を使えるようにする。
- WSL で Ubuntu20.04 を使えるようにする。
- WSL の Ubuntu20.04 に Raku (以前は Perl6 と呼ばれていた) というプログラミング言語の環境を入れる。
- Raku の Math::Libgsl::Matrix というモジュールを使えるようにする。
要点
あまり情報が見つからなかったのは上の 3. と 4. です。これは WSL で Ubuntu20.04 が動いているのであればその端末で
sudo apt install rakudo perl6-zef
sudo apt install gcc make
sudo apt install libgsl-dev libgsl23 libgslcblas0 libffi-dev libtommath-dev libatomic-ops-dev libuv1-dev
zef install Math::Libgsl::Matrix
を実行することでできるようになります。
詳細
WSLの機能をオンにする
デスクトップ左下の Windows マークから「設定」->「アプリ」->「アプリと機能」->「プログラムと機能」->「Windows の機能の有効化または無効化」の「Linux 用 Windows サブシステム」にチェックを付けて再起動します。Windows10 以前の Windows には WSL はありません。

WSL で Ubuntu20.04 を使う
「Microsoft Store」から「Ubuntu 20.04 LTS」を「入手」します。2020年8月の感覚では安定していて情報もたくさん転がっている Ubuntu18.04 にするか新しい Ubuntu 20.04 にするかちょっと迷うところですがせっかくなので新しい方を入れます。


「Ubuntu 20.04 LTS」を起動します。

最初にユーザーネームとパスワードを登録します。パスワードはセキュリティのためにタイプしても画面には表示されないことと、確認のために2回入力する必要があることに注意します。

次にインストール直後の Ubuntu20.04 をアップデートします。まず Ubuntu のソフトウェアをインストールやアップデートするときにファイルをダウンロードしてくる元(リポジトリ)を自分の近くのサーバにしておくとダウンロードが速くなります。日本国内なら JAIST(北陸先端科学技術大学院大学)のミラーサーバにしておくと吉です。
sudo sed -i -e 's%http://.*.ubuntu.com%http://ftp.jaist.ac.jp/pub/Linux%g' /etc/apt/sources.list
下のような感じでコマンドを打っていきます。sudo は、管理者 (superuser) 権限で実行 (do) する、という意味です。先ほど入力したパスワードを入れて自分がただのゲストユーザではないことを証明する必要があります。

アップデートします。
sudo apt update
sudo apt upgrade
途中、「こういうパッケージをインストールして容量これだけ使うけど続けていい?」ということを尋ねてくるので Yes の意で「Y」と打ちます。

Rakuを使えるようにする
Raku のコンパイラである Rakudo とモジュールのインストーラである Zef をインストールします。Raku, Rakudo, Zef 等々が何かという話はここやここにあります。
sudo apt install rakudo perl6-zef
よくお勧めされているのは Rakudo Star という Rakudo, Zef, 各種モジュール がひとまとめになったバンドルをインストールするというものです。Windows に直に環境を入れるなら Rakudo Star Bandle のインストーラを使う方法 が一番楽だと思いますが、Ubuntu に入れるにはソースをダウンロードして自分で MoarVM, NQP, Rakudo を Configure していく作業が必要そうなのでここでは上の方法をとります。apt install rakudo するときに NQP と MoarVM は一緒にインストールされます。必要なモジュールはまた後で自分でインストールします。
ここまでで Raku は実行できるようになっています。端末に Rakudo と打ち起動した REPL に "Hello, world".say と打てば Hello, world が表示されます。 "Hello, world".say はオブジェクト指向っぽい書き方ですが、エビバディセイイェー!みたいな感じで良いですよね。また say "Hello, world" でも同じことになります。

exit と打てば REPL が終了します。
Math::Libgsl::Matrix モジュールを入れる
ちょっと行列やベクトルの計算がしたいのでそのためのモジュールを入れます。Raku のモジュール の数学 (MATH) 関係のところに Math::Libgsl::Matrix というのがあるのでこれを使わせてもらいます。
Math::Libgsl::Matrix は Gnu Scientific Library (GSL) へのインターフェースとのことです。Raku のモジュールとかではなくて外にある(C言語の)ライブラリですので、この Ubuntu に GSL を入れる必要があります。Math::Libgsl::Matrix のページの Prerequisites のところに必要なライブラリ等が書いてあります。これを参考に必要なものを揃えます。
sudo apt install gcc make
sudo apt install libgsl-dev libgsl23 libgslcblas0 libffi-dev libtommath-dev libatomic-ops-dev libuv1-dev
sudo apt install gcc make の部分は sudo apt install build-essential でもいいような気はします。
ものが揃ったら Math::Libgsl::Matrix を入れます。
zef install Math::Libgsl::Matrix
これは結構時間がかかると思いますので気長に待ちましょう。
Math::Libgsl::Matrix が無事に入れられたらテストしてみます。プログラムを書く前に Raku のシンタックスハイライトができるように vim-raku というプラグインを入れます。
git clone https://github.com/Raku/vim-raku.git ~/.vim/pack/vim-raku-pack/start/vim-raku
test-vec.raku など適当な名前でプログラムを書きます。vim を起動し


rakudo test-vec.raku で実行します。

WSL のプラスアルファ
ファイルの移動
ファイルエクスプローラのパスのところに \\wsl$ と入れると Ubuntu が見えるので通常通りの方法でファイルを移動できます。

もしも WSL の Ubuntu をリセットしたくなったら
なにか取り返しのつかないミスをしていて「最初からやりなおしたい」と思ったら、「設定」->「アプリ」->「アプリと機能」->「Ubuntu 20.04 LTS」->「詳細オプション」から、


今日の学び
エラーメッセージを読む
環境構築やコンパイル等々、だいたい一発でうまくいきません。大切なのはエラーメッセージを読んで次何を試してみるかのアタリをつけることです。例えば今回の zef install Math::Libgsl::Matrix をやってみたときに、結果が下の図のようになったとします。

根気強く読んでいくと「make: not found」と書かれています。「そういえばまだ make を install してなかった」と気づいたら sudo apt install make を実行します。
見つかった問題を片づけたら再度 zef install Math::Libgsl::Matrix を実行してみます。

ではライブラリを入れましょう。それっぽい名前のパッケージを探します。apt search tommath と実行すると、

sudo apt install libtommath-dev を実行してまた zef install Math::Libgsl::Matrix を実行します。さっきの「cannot find -ltommath」が消えていたら一つ問題を潰したことになります。
と、このような感じで地道に問題を解決していけば最後には輝かしい未来が待っていることでしょう。
所感
「モジュール入れずに配列でやったらダメなの?」「Perl なら数値計算よりテキスト処理では?」「行列計算したいなら Python の numpy を使えば?」等々色々な意見がある気もしますがとりあえず今回はこれで。それではまた。
References
Raku について
- らくらくPerl6入門 https://hackmd.io/@WNHcrD46SCuzq-ajxtf0lA/HJVfXZY9S
- Raku 入門 https://raku.guide/ja/
WSL について
- WSL(Windows Subsystem for Linux)の導入とUbuntuの初期設定 https://qiita.com/kerobot/items/b4f5472d71119506baaa
- WSLとwindows間のファイル連携 https://qiita.com/quzq/items/1096c638c0d86795be13
エラーメッセージについて
- makeで「/usr/bin/ld: cannot find」と表示されるときは https://www.atmarkit.co.jp/flinux/rensai/linuxtips/a115makeerror.html
どうもありがとうございました。